New or Returning Visitor
Do you know how many of your website visitors are new visitors and how many have visited before?
This is a key (and often overlooked) audience demographic to know and understand. It reveals how well your website is performing as a business asset and helps to define how to tailor your marketing going forward.
If you are only receiving new visitors and no return visitors, there is more than likely something wrong. It could be that the website provides a poor user experience, your marketing is attracting a low intent of visitors, your products or services are not performing as well as intended, you do not have an effective remarketing strategy in place. By understanding the very basics of who is visiting your website, you can then start to look deeper into how effective your site actually is.
So, how do we tell is a visitor is a new visitor or a returning visitor? Simples.
Without a doubt Google Analytics is the most powerful data rich tool you can use to help you understand the true performance of your website. It is also one of the most complicated!
It provides a wealth of information about your site’s audience, from the age, locations and interests, to how they navigate around your site and how they arrived at it in the first instance.
Let’s Take A Closer Look
Google Analytics treats “new users” differently than you may think so it’s important to remember this when looking at the data:
New Visitors are those navigating to your site for the first time on a specific device. If someone visits your website from a desktop computer at work, and then visits the website again from their mobile, Google Analytics would record them as 2 new users.
Google is continually developing and can now detect that if you are logged in to your Google Chrome account and are using the Chrome browser, it would count you as a new visitor on one device and a returning on the other.
Returning Visitors have visited your site before within a 2-year period. If the returning visit is more than 2 years from the previous visit, the person is counted as a new visitor again.
Where to find the data
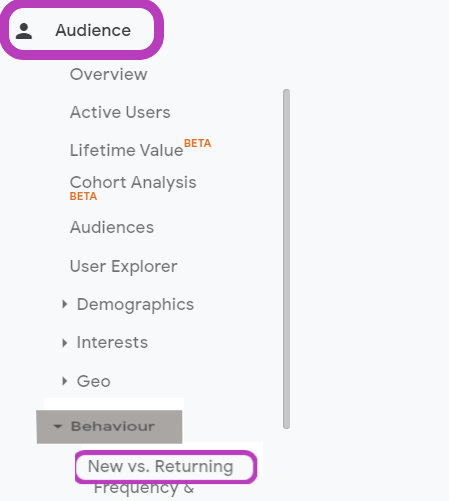
To locate the data, open your Google Analytics dashboard and click on “Audience” on the left hand side and then “Behaviour” and then “new vs returning”.

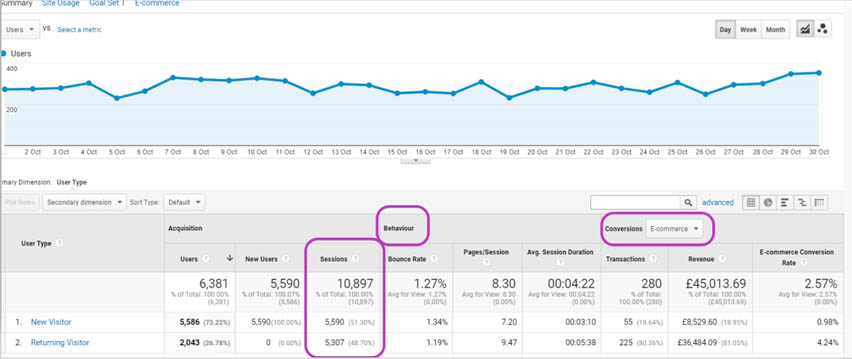
You’ll see a screen with a line graph at the top (you can ignore this as it’s not overly helpful) and a chart below (pay attention to this as it holds the most valuable data!).
The three areas to look at are highlighted below:

- Sessions – compare the number of new visitors to your website with the number of repeat visitors.
- Behaviour – Compare how differently new and returning visitors act when they are on your site. See how long each visitor type spends on the site and how many pages they visit on average. The “bounce rate” is the percentage of visitors that leave the website without visiting a second page.
- Ecommerce/Goals – Shows the value of sales and the number of transactions or the number of goal completions that you have set up to record. You’ll be able to see whether new or returning visitors complete purchases or other goals more often.
Interpreting the data
So, you can now see what proportion of your visitors are new and returning and who spends the longest time on the website and who takes the required action that you want. What do you do with that information?
More new visitors than returning
If you have more new visitors month on month than returning users, you may want to take a look at the website content, design, speed, checkout/call to action process. There could be fundamental issues with the website forcing people to give up and go elsewhere.
If those new users are actually completing goals (whether it’s signing up to a newsletter or making a purchase etc) but are not returning, you may want to review the performance of your product or service to ensure it is “doing what it says on the tin”. You may want to engage in a remarketing campaign targeting those new users with an offer enticing them to return and carry out another goal/purchase.
More returning visitors than new
Utilise your loyal visitors by asking them to spread the word for you! Offer incentives for referrals.
If the returning visitors are completing your goals more than new visitors, you may want to incentivise new visitors to stay on the site and carry out your required action on their first visit. This could be an immediate use offer pop up (exit intents are a good way to do this). Does the website provide enough information for new users to make a decision on their first visit without needing to do more research elsewhere?
If the bounce rate is higher for new visitors, your site is no longer engaging them. Has the site been redesigned? We’ve all experienced the frustration of a supermarket moving products around when we just want to quickly pop in for one item but it takes five times as long to find it. Are you updating the site with new information regularly to increase interest?
Things to consider before making decisions on data
It is important to understand that while this is valuable data, it is only part of a much bigger picture. Use all data sources available to you before making any strategic decisions. Make sure the timeline in which you base your decisions on is lengthy (3-6 months minimum). If your business experiences seasonal trends, take this into consideration. Also take into account that if your website receives very little traffic (50-100 visitors a month say), using solely this data to drastically alter your overall business strategy could be a mistake. If you receive a larger volume of traffic, you can quickly start to build up a good level of conclusive data and be confident is applying strategies based on it.
There are many areas in which Analytics can provide valuable insights into your website’s performance. We’ve covered just one in this article. If you would like to know more, please get in touch.


Recent Comments